
A website that shows how much the Italian State spends, with the source next to every number
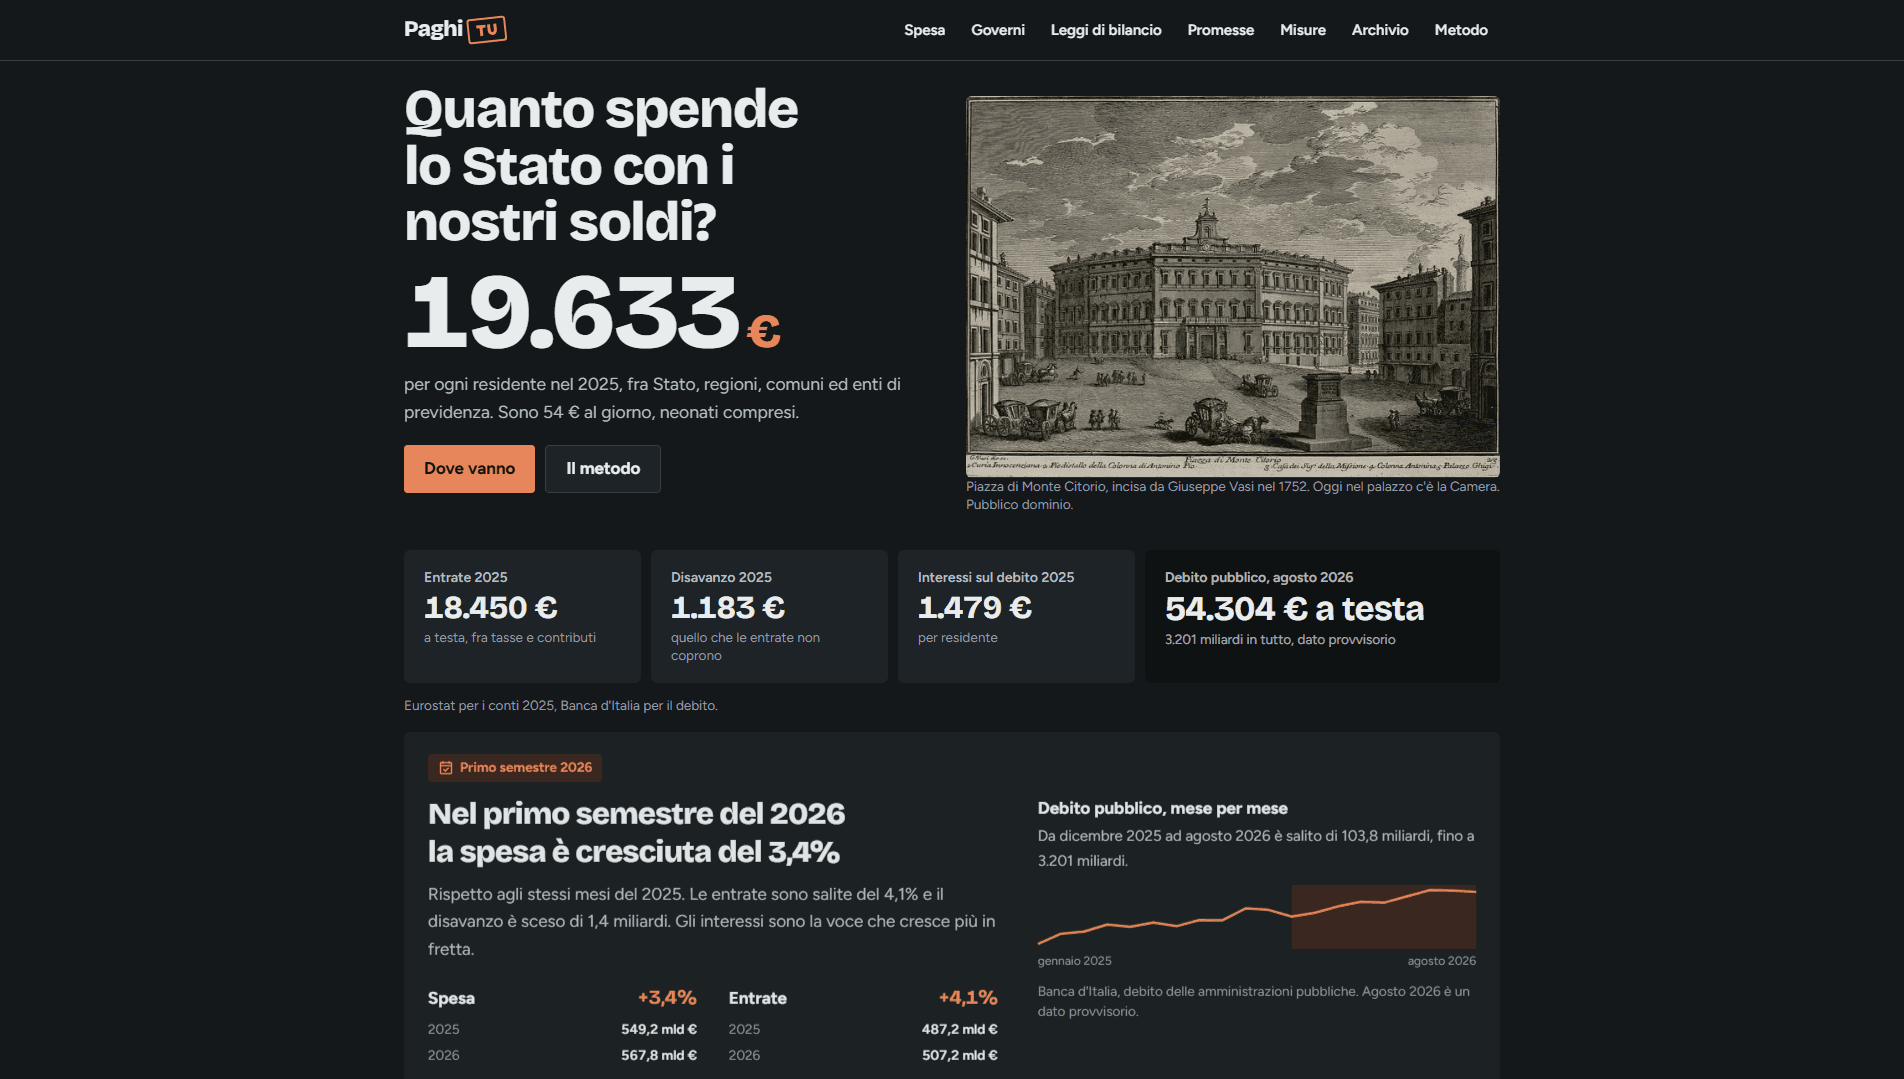
Public spending per resident, the accounts of every government, the expected and actual cost of past measures, and the parties' promises for the 2027 general election. A routine of AI agents updates the data every day, and a second agent checks it against the sources before it goes live.

- Client
- M's Works
- Sector
- Public finance data · Italy
- Services
- Web & App Development · UI/UX & Design System
- Online
- www.paghitu.it ↗
The context
Paghi Tu is an M's Works project, non-partisan and open source, that answers one question: how much the Italian State spends with the money of the people who live there. The answers exist, but they are scattered across Eurostat, the Bank of Italy, ISTAT, the Chamber of Deputies and Normattiva, in different units and periods, and the figures that circulate often don't say where they come from. With the general election expected in 2027, the parties' promises come on top, to be lined up with the same rules for everyone.
The problem
The same quantity has different values depending on the source, and mixing them creates jumps nobody can explain.
Official sources change address, revise their data and sometimes don't respond: ISTAT blocks anyone who exceeds five requests a minute for one or two days.
Attributing a measure to the wrong government is easy: in 14 financial years the budget law was proposed by one government and enacted by another.
A website about election promises has to treat every party the same way, down to the colours and the timing of publication.
The data has to be updated every day, without a person having to reread every number.
Every choice has a constraint behind it
The constraint
On a website about public accounts and promises, a wrong attribution isn't a typo: it's an accusation against someone. And the first draft of the research had some, such as a multi-year measure attributed entirely to one government.
The choice
Three levels: the research, a second agent that reopens the primary source, a cross-comparison between the notes. The page shows the level reached, and whatever is still unverified isn't published.
Why
Spot checks or automatic checks alone were faster, but the errors found were attribution errors: a format check doesn't see them, only someone who rereads the source does. That's why a measure can be linked to several governments, with each one's acts.
The constraint
An automatic update puts numbers online that nobody has looked at first.
The choice
The pipeline compares independent sources with 7 cross-checks, such as the Bank of Italy's debt against Eurostat's or the four quarters against the year, and stops if one doesn't match.
Why
Trusting a single source was the simple route, and it would have published a real error: for the years before 1999 Eurostat's euro series converts lire at that year's ECU rate, and the 1995 debt came out 7% lower. The comparison with the Bank of Italy caught it before it went live.
The constraint
Sources and promises change every day, and a pull request to approve by hand every morning depends on a person being free every morning.
The choice
A routine of AI agents updates the data every day and publishes on its own, but only after confirmation from a second agent that didn't write the changes and checks them against the sources. Numbers from the APIs and content about parties follow two separate tracks.
Why
Publishing without a check was faster, manual approval slower and more fragile. The second agent answers «confirmed» or «rejected» line by line, and anyone can report an error: every correction stays in a public log, with the value before and after.
The constraint
Publishing one party before the others, or giving it a colour, is already taking sides.
The choice
The promises go live all together, only after every party has passed the same check and a symmetry review. A paper-and-ink palette with a single accent, no colour linked to any party.
Why
Publishing one party at a time, as each was ready, would have brought the data online sooner, and for days shown only one side. Party colours, as on election results sites, would have suggested an affinity where there is none.
The constraint
Few promises come with a figure from whoever makes them, and none has an independent estimate.
The choice
No estimate of our own: the site shows the proposer's figure, translated into euros per resident, next to how similar measures went in the past. No totals per party.
Why
Our own estimate of a programme's cost would have been a judgement on that programme. The comparison with past measures is labelled as a calculation, not a forecast, and is only made on comparable bases.
What we built
The receipt per resident
Public spending split per resident and by function, debt month by month since 1945, a comparison with Europe as a share of GDP.
Every government's accounts
Debt at the start and end of each term, debt to GDP and budget laws with the government that proposed them, without attributing causes.
Expected versus spent
For ten past measures, the cost estimated in the technical reports next to the actual one, with the gap shown only where the bases are comparable.
The promises for 2027
The exact sentence, who said it, when and where, the verification level and, where there is one, the declared cost translated into euros per resident.
Archive and corrections
A search across governments, laws, measures and promises, a public corrections log and error reports on GitHub, with the source required.
The outcome
320
promises from 20 parties published as of 21 October 2026, each with the exact sentence, the source and the verification level
7
cross-checks between independent sources that stop publication if a number doesn't match
18
comparisons between expected and actual cost across ten past measures
2
days from the first commit to the site live on paghitu.it, on 20 and 21 October 2026
Open source under the MIT licence: anyone can check how every calculation is made.
Technologies
Got a similar project?
Tell us where you're starting from. We'll reply with a clear proposal and realistic timelines, no commitment.